Inconclusive A/B test results are far more common than most teams expect. According to Experiment Engine, between 50% and 80% of A/B tests return inconclusive results, and some industry estimates push the “failure” rate even higher - closer to 80-90% - noting that tests that technically reach significance but produce results too small to act on also count. For most teams, inconclusive is the default outcome - not the exception.
The instinct is to blame the idea that was tested, or the audience, or the timing. Occasionally those things matter. But the more common culprit is structural - problems baked into how the test was designed, sized, or run before a single visitor ever saw a variant. These aren’t random failures. They’re predictable ones, which means they’re fixable.
What follows isn’t a lecture on statistics - it’s a helpful look at the recurring reasons A/B tests stall out before they ever get useful - and what you can do about them.
Key Takeaways
- Between 50-90% of A/B tests return inconclusive results, making failure the default outcome, not the exception.
- Vague hypotheses, wrong timing, and misaligned goal metrics cause most test failures before any visitor sees a variant.
- Running tests on insufficient traffic or stopping early dramatically inflates false positive rates through a habit called peeking.
- Tracking too many metrics or using proxy metrics instead of actual outcome metrics turns valid tests into misleading noise.
- Aggregate results can hide opposing segment behaviors; breaking down data by device or traffic source reveals actionable insights.
Why Most A/B Tests Are Set Up to Fail Before They Launch
The outcome of an A/B test is largely decided before a single visitor lands on a variation. The hypothesis you write, the metric you track, and how you run the test - these foundational choices shape everything that follows.
But most teams spend very little time on this phase.
There’s pressure in product and marketing teams to move fast and ship things. So the hypothesis gets written in five minutes, the goal metric gets pulled from whatever’s easiest to measure, and the test goes live before anyone has asked the hard questions.
The problem with a vague hypothesis is that it produces vague results. If your hypothesis is “changing the button color will improve performance,” you haven’t defined what improvement means or why the change should work. You’re not testing an idea - you’re running a change and waiting to see if it makes a difference.
Ronny Kohavi, Diane Tang, and Ya Xu address this directly in their 2020 book on honest online controlled experiments. They make the case that a well-formed hypothesis needs to connect a change to a user behavior through a plausible mechanism. If you don’t have that structure, even a result that reaches statistical significance can be hard to interpret or act on.
Timing is another factor that teams underestimate. Running a test during a product launch, a sale period, or an unusually slow week introduces noise that has nothing to do with the variation you’re testing. The data you collect ends up reflecting external conditions as much as user response to your change.
The goal metric matters just as much. Teams frequently track a metric because it’s available instead of because it’s the right one. Click-through rate is easy to pull. But if your goal is to increase revenue per user, click-through rate might not tell you anything helpful. A proxy metric that doesn’t connect tightly to your goal is one of the quieter ways a test can mislead you. Tracking micro-conversion metrics can help bridge the gap between surface-level clicks and outcomes that actually matter.
None of this is complicated in theory. But the gap between knowing it and doing it is where most tests go wrong. How you size your test and what you set as a significance threshold is where things get even more layered. If you’re evaluating A/B testing tools for your website, it’s worth checking whether they support proper hypothesis documentation and goal metric selection before you commit.
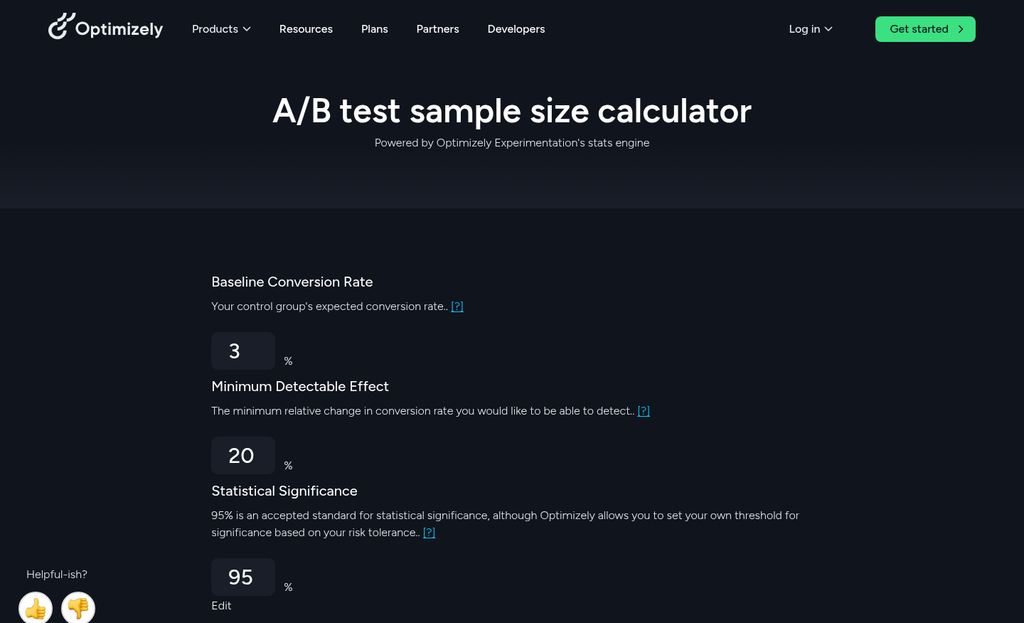
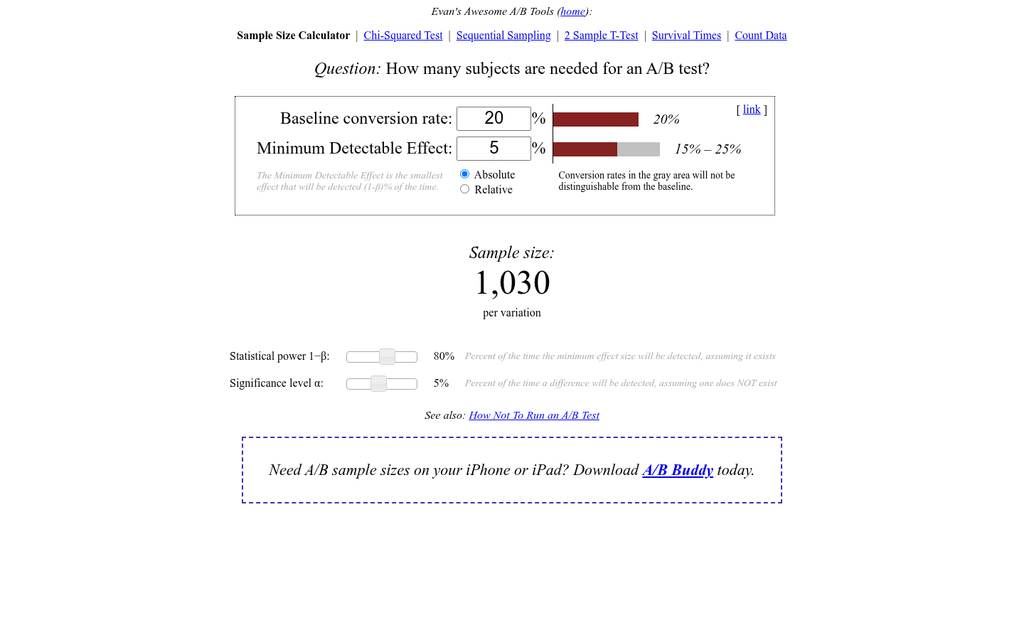
The Sample Size Trap That Skews Nearly Every Result
One of the most common ways to get a false result from an A/B test is to run it on too little traffic for too short a time. The math behind statistical significance sounds scary. But the core idea is easy. A p-value below 0.05 means there’s less than a 5% chance your result happened by random chance alone - it does not mean your result is correct or actual.
Teams treat that 95% confidence threshold as a finish line to cross as fast as possible. But chasing it with a small sample size is like flipping a coin four times and declaring heads is “winning.” You need enough data for the pattern to actually emerge from the noise.
The amount of traffic can depend on how big a difference you expect to see between your two variants. Smaller expected differences need bigger sample sizes to detect reliably. If your site gets modest traffic, a real test can take weeks - not days. Tools like Crazy Egg or Microsoft Clarity can help you understand where traffic is going before you even set up a split test.
| Traffic Level | Daily Visitors per Variant | Realistic Test Duration | Reliability Outcome |
|---|---|---|---|
| Small | Under 500 | 6-10 weeks | High risk of false positives or inconclusive results |
| Medium | 500-5,000 | 2-4 weeks | Reliable if test runs to completion without peeking |
| Large | 5,000+ | 1-2 weeks | Strong reliability with low variance in results |
Notice that even medium-traffic sites need two to four weeks to get a reliable read. Most teams call it early because they see a promising number and want to act on it.
That habit - checking results every day and stopping when things look good - is called peeking, and it actively inflates your false positive rate. Every time you look at live data and make a stopping choice, you are running multiple tests on the same experiment. That compounds your error rate in ways that are hard to untangle later. The same discipline applies when testing scroll-triggered versus time-delay popups - letting either run too briefly produces equally misleading conclusions.
Decide your sample size target before the test starts and follow it. The result you get at day three is not the same result you would get at day twenty-one.
How Poorly Defined Metrics Turn Valid Tests Into Noise
Sample size gets attention. But metric selection quietly does just as much damage. You can run a well structured test with the right number of participants and still walk away with results that mean nothing - because you measured the wrong thing.
This happens more than most teams know. When a test launches, there’s a temptation to track everything. Page views, clicks, scroll depth, time on site, form starts, form completions. The logic seems basic: more data gives you more to work with. But measuring too many things at once dilutes your ability to reach a conclusion on any one of them.
Every metric you add increases the chance that at least one of them will show a statistically significant result by pure chance; it’s not a win - it’s noise dressed up as a finding.
The fix is to choose a single primary metric before the test starts and treat everything else as a secondary signal. Your primary metric is the one number that determines if the test succeeded or failed. Secondary signals help you understand why - but they don’t get a vote on the outcome.
Here’s where teams get into trouble: picking a primary metric that’s a proxy for what they actually care about. Clicks are a classic example. A button that gets more clicks looks like a winner on paper. But if those extra clicks don’t cause purchases, you haven’t improved anything. You’ve optimized for an action that sits one step away from the goal you actually care about. The psychology behind high-converting call-to-action buttons makes this distinction especially important.

The distance between a proxy metric and an outcome matters quite a bit. The further apart they are, the more room there is for a misleading result to form.
Before any test goes live, ask yourself if your success metric is the thing or just a signal of the thing. Clicks signal intent. Revenue confirms it. Email opens signal interest. Conversions confirm it. If you’re measuring the signal and calling it the outcome, your results will look cleaner than they actually are. Teams focused on actual conversion outcomes often find it useful to optimize their signup pages for maximum conversions with the real goal firmly in mind.
| Proxy Metric | Actual Goal | The Gap |
|---|---|---|
| Button clicks | Completed purchases | User clicked but didn’t buy |
| Email opens | Link clicks or conversions | User opened but didn’t act |
| Time on page | Content comprehension or sign-ups | User lingered but didn’t convert |
| Form starts | Form completions | User began but abandoned |
Inconclusive results don’t always come from bad data. Sometimes they come from measuring something that was never close enough to the finish line. Using micro-commitments to increase conversions can help close that gap by moving users incrementally toward outcomes that actually matter.
The Segment Illusion - When Averages Hide What’s Actually Happening
An inconclusive result doesn’t always mean nothing happened- it can mean two very different things happened at the same time and averaged each other out.
Aggregate data is helpful. But it flattens everything. When you look at your test result as a single number, you lose the story underneath it. Mobile users may have responded strongly to your variant while desktop users moved in the opposite direction. New visitors may have converted more while returning visitors converted less. These effects can cancel each other out in the result, which makes the test look like it showed no winner when it actually showed two answers - just for different groups.
There’s a well-documented statistical phenomenon called Simpson’s Paradox where a trend that appears in combined data disappears or reverses when you break the data into subgroups. It’s not an edge case - it’s a pattern that shows up in A/B testing when audience segments behave differently from each other. It’s worth ten minutes of your time to look it up.
The table below shows an easy example of how this plays out in practice.
| Segment | Control Conversion Rate | Variant Conversion Rate | Winner |
|---|---|---|---|
| Mobile users | 3.2% | 5.1% | Variant |
| Desktop users | 6.8% | 4.9% | Control |
| Combined | 4.9% | 5.0% | No difference |
At the aggregate level, that test looks like a dead end. But it isn’t. There’s a real and usable result sitting inside it - you just have to look at the right level.
Traffic source is another place where this happens. Paid traffic and organic traffic behave like different audiences because they arrive with different levels of intent. Geography matters too. A layout change that works in one market can land flat in another because of cultural differences in how people read or use a page.
The question to carry into every inconclusive result is this: inconclusive for whom? Flat averages are not the same as no effect. A breakdown of your results by device, traffic source, or user type takes extra time. But it turns dead ends into direction.
What Teams Running Winning Tests Do Differently
There’s a stat worth sitting with for a bit. Research from VWO and Convert.com puts the average test win rate at around 1 in 7. But teams running structured optimization programs win closer to 1 in 3. Same tools, same places - different strategy.
High-performing teams don’t get lucky more. They’ve built habits that make every test - win or lose - move them forward.
They treat prioritization as a discipline
Most teams run tests based on what’s easy to build or what got pushed for in a meeting. High-performing teams use a scoring framework to rank test ideas by possible results, confidence in the hypothesis, and effort to execute - this keeps the roadmap focused on tests worth running instead of tests worth finishing.
It’s a small process change that compounds over time. Fewer weak tests means fewer inconclusive results filling up your data.

They document what they learn, not just what they win
This is probably the biggest difference between average and high-performing programs. When a test loses, most teams archive it and move on. High-performing teams write down what the result tells them about their audience, their assumptions, or their product.
That documentation can become a knowledge base - it stops teams from re-testing the same dead ends and helps new hypotheses get sharper faster.
Concrete habits that separate the best programs
- Every test starts with a written hypothesis that names the expected outcome and the reasoning behind it.
- Sample size and test duration are calculated before the test goes live, not after results come in.
- Tests are reviewed by more than one person before launch to catch instrumentation problems early.
- Losing tests get a structured debrief, not just a closed ticket.
- Results are shared across teams so product, design, and marketing are building on the same learnings.
None of this is technically hard - it’s mostly about slowing down enough to do the work before hitting launch. If you’re also looking at small design changes that move conversion numbers, the same disciplined approach applies there too.
The real gap is cultural, not technical
The teams winning more tests aren’t smarter or better resourced. They’ve decided that the goal of testing is to learn something true - not to validate what they already believe.
That mindset change is harder than fixing your sample size or cleaning up your segmentation. But it’s also what everything else builds on. Tools like dedicated CRO platforms can support the process, but only once the culture behind the work is solid.
Stop Blaming the Algorithm - Start Fixing the Process
The good news is that these are all correctable problems, and you don’t need to overhaul everything at once. Most testing programs improve dramatically once you start asking harder questions before the test launches, not after.
One helpful place to start: before you configure your next test, write down the hypothesis in a single sentence that includes what you’re changing, who you expect it to affect, and why you think it will move a metric. If that sentence feels hard to write, that difficulty is telling you something. A hypothesis you can’t articulate is one that a test can’t reliably confirm or deny. Get that one thing right, and you’ll already be running better experiments than most.
FAQs
Why do most A/B tests return inconclusive results?
Most A/B tests fail due to structural problems like vague hypotheses, wrong goal metrics, and insufficient sample sizes - all decided before a single visitor sees a variant. These are predictable, fixable issues rather than random failures.
What is "peeking" and why does it matter?
Peeking is the habit of checking live test results daily and stopping early when numbers look promising. This inflates your false positive rate by effectively running multiple tests on the same experiment, compounding errors that are difficult to untangle later.
How do proxy metrics cause misleading A/B test results?
Proxy metrics like click-through rate sit one step away from your actual goal. A button getting more clicks looks like a win, but if those clicks don't lead to purchases, you've optimized for the wrong thing entirely.
What is Simpson's Paradox in A/B testing?
Simpson's Paradox occurs when opposing behaviors from different audience segments cancel each other out in aggregate data, making a test appear inconclusive. Breaking results down by device, traffic source, or user type often reveals clear, actionable winners hidden beneath flat averages.
What habits separate high-performing testing teams?
High-performing teams write structured hypotheses before launch, calculate sample sizes in advance, and document what losing tests reveal about their audience. This disciplined approach raises win rates from roughly 1-in-7 to nearly 1-in-3.
